Engine Displacement Chart — Every Common Engine Family Listed by CC, CI, and Liters
30-second answer: this engine displacement chart lists every common engine family with its factory bore × stroke, cylinder count, and displacement in cc, cubic inches and liters. Chevy's 350 computes to 5,733 cc (349.8 ci), the 5.7 HEMI to 5,655 cc (345.1 ci), the LS3 to 6,163 cc (376.1 ci) and Ford's 7.3 L Godzilla to 7,293 cc (445.0 ci). Every number below is computed from geometry — not copied from a badge — so you can re-derive any row with the engine displacement calculator.
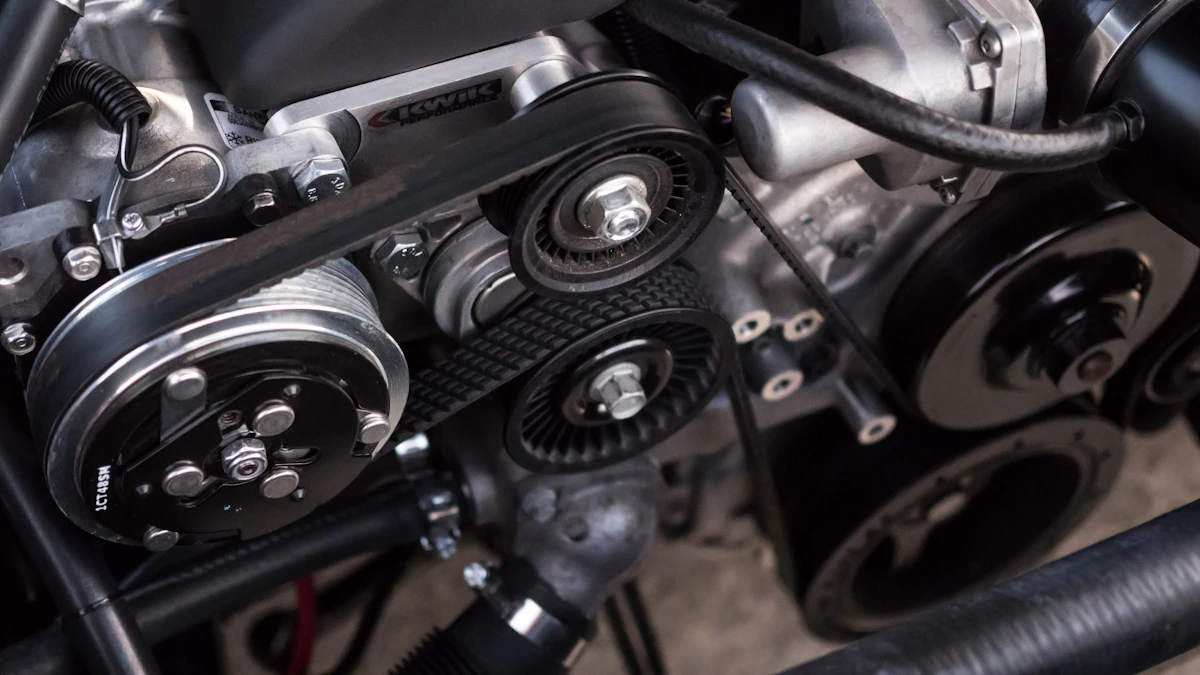 Every row on this chart starts with two numbers: bore and stroke
How This Displacement Chart Was Built (and How to Check It)
Most engine spec charts floating around forums copy badge numbers from other charts, which is how errors survive for decades. This page takes the opposite approach: each row stores only the factory bore, stroke and cylinder count, and every cc, cubic inch and liter figure is computed live on the page from Displacement = (π/4) × bore² × stroke × cylinders. That single decision has three consequences worth understanding before you use the table.
First, the numbers are honest about rounding. When the chart shows 6,163 cc for the LS3 while Chevrolet's documentation says 6,162 cc, that one-cubic-centimeter gap is the rounding already present in the published bore dimension (103.25 mm is a rounded version of the final machined value). Second, badges and geometry diverge on purpose: a 350 that computes to 349.8 ci and a 107 that computes to 106.5 ci are not errors in this chart — they are the factory marketing department doing its job. Third, where authoritative dimensions simply do not exist, the chart says so instead of guessing: the original 7.3 L Power Stroke row carries the factory displacement with its geometry column marked n/a, and Caterpillar's 3406 is omitted entirely because the surviving figures do not reconcile with the factory's own displacement documentation.
 Bore × stroke × cylinders — the only three inputs behind every row
Conversion constants used
- 1 cubic inch = 16.387064 cc (exact, by the 1959 inch definition)
- 1 liter = 1,000 cc (exact, metric definition)
- 1 inch = 25.4 mm (exact) — used to convert factory inch dimensions
- CC figures rounded to the nearest whole cc; CI to one decimal
Want the full derivation of the volume formula itself? The engine displacement definition guide walks through every term step by step.
The Engine Displacement Chart by Family
Pick a family tab. Each table lists the engine, cylinder count, factory bore × stroke, and the displacement computed from that geometry in all three units. The years column reflects the engine's production run in its best-known application.
Chevrolet & Pontiac V8 Displacement Chart
No engine family has more cubic-inch folklore than the Chevrolet small-block. The famous 350 badge actually computes to 349.8 cubic inches from its 4.000 × 3.480 in bores and strokes — the factory rounded up to a friendlier number, and the name stuck so hard that people say "a 350" the way they say a model name. The same rounding story repeats across the family: the 454 big-block is a genuine 454.0 ci from geometry, while the ZZ 502 crate motor computes to 501.1 ci and lives on badge rounding alone.
The Gen III/IV LS family moved to metric thinking. The LS3 badge says 6.2 L, and its 103.25 × 92.0 mm dimensions compute to 6,163 cc (376.1 ci) — within 0.05% of the factory's 6,162 cc figure, which is as close as published one-thousandth-of-a-millimetre rounding can get. If you want the full arithmetic for each row, the engine displacement calculator reproduces every number in this table live.
| Engine | Cyl | Bore × Stroke (mm) | CC | Cubic Inches | Liters | Years |
|---|---|---|---|---|---|---|
| Chevy 350 small-block V8 Badge says 350 ci; geometry computes to 349.8 ci (5,733 cc). | 8 | 101.6 × 88.4(4.00 × 3.48 in) | 5,733 | 349.8 | 5.7 | 1967–2003 |
| Chevy 383 stroker V8 Classic 4.030 × 3.750 in crank-and-bore package built from 350 blocks. | 8 | 102.4 × 95.3(4.03 × 3.75 in) | 6,279 | 383.2 | 6.3 | Aftermarket, 1980s–present |
| Chevrolet LS3 6.2 L V8 Computed 6,163 cc vs factory 6,162 cc — within published rounding. | 8 | 103.25 × 92(4.06 × 3.62 in) | 6,162 | 376.0 | 6.2 | 2008–present |
| Chevrolet LS7 7.0 L V8 4.125 × 4.000 in — the largest factory small-block displacement. | 8 | 104.78 × 101.6(4.13 × 4.00 in) | 7,009 | 427.7 | 7.0 | 2006–2015 (crate to present) |
| Chevy 454 big-block V8 A rare case where the badge matches the geometry exactly: 454.0 ci. | 8 | 107.95 × 101.6(4.25 × 4.00 in) | 7,439 | 454.0 | 7.4 | 1970–2001 |
| Chevrolet ZZ 502 crate V8 Computes to 501.1 ci — the 502 badge is factory rounding. | 8 | 113.4 × 101.6(4.46 × 4.00 in) | 8,209 | 500.9 | 8.2 | Crate program, 1990s–present |
| Pontiac 400 V8 Compute gives 400.1 ci — Pontiac's badge is one of the honest ones. | 8 | 104.65 × 95.25(4.12 × 3.75 in) | 6,554 | 399.9 | 6.6 | 1967–1979 |
Section A — CC to CI to Liters Conversion Ladder
Charts like the one above mix three units because the automotive world never agreed on one. This ladder converts the common badge sizes between them using the exact factors — 16.387064 cc per cubic inch and 1,000 cc per liter — so you can translate any row of the family chart into the unit your head thinks in. Two anchors are worth memorizing: one liter is almost exactly 61 cubic inches, and one cubic inch is almost exactly 16.4 cc. With those two anchors you can sanity-check any displacement claim in your head to within half a percent.
| Liters (badge) | CC | Cubic Inches |
|---|---|---|
| 1.0 L | 1,000 | 61.0 |
| 1.5 L | 1,500 | 91.5 |
| 2.0 L | 2,000 | 122.0 |
| 2.5 L | 2,500 | 152.6 |
| 3.0 L | 3,000 | 183.1 |
| 3.5 L | 3,500 | 213.6 |
| 4.0 L | 4,000 | 244.1 |
| 5.0 L | 5,000 | 305.1 |
| 5.7 L | 5,700 | 347.8 |
| 6.2 L | 6,200 | 378.3 |
| 7.0 L | 7,000 | 427.2 |
| 8.0 L | 8,000 | 488.2 |
Section B — The Same Displacement, Split Different Ways
Cylinder count does not change total displacement — it changes how that displacement is packaged, and packaging decides character. Split the same volume across more cylinders and each cylinder gets smaller and lighter, so it can fill and empty faster: that is the road from a 2.0 L four-cylinder revving past 8,000 rpm to a 7.0 L V8 making its torque at 4,500. The table below divides four common total displacements by cylinder count to show the per-cylinder volume each layout asks its pistons to sweep.
| Total | 4-cyl (cc/cyl) | 6-cyl (cc/cyl) | 8-cyl (cc/cyl) | 12-cyl (cc/cyl) | Chart example |
|---|---|---|---|---|---|
| 2.0 L | 500 | 333 | 250 | 167 | K20A2 · 4-cyl (998 cc/cyl) |
| 3.0 L | 750 | 500 | 375 | 250 | 2JZ-GTE · 6-cyl (500 cc/cyl) |
| 5.0 L | 1,250 | 833 | 625 | 417 | Coyote · V8 (619 cc/cyl) |
| 7.0 L | 1,750 | 1,167 | 875 | 583 | Godzilla · V8 (912 cc/cyl) |
Read the example column against the per-cylinder numbers and the family chart above starts explaining itself. The 2JZ's 500 cc cylinders are almost exactly a K20 cylinder doubled — which is why both engines make similar power per liter at similar boost. The Godzilla's 912 cc cylinders are longer-stroke and lower-revving by design; no amount of tuning makes a 912 cc cylinder spin like a 412 cc one. When builders talk about an engine being "undersquare" or "oversquare," they are really talking about where on this grid the engine sits.
Section C — Chart Rows by Aspiration
Aspiration never changes the number in the displacement column — swept volume is pure geometry — but it completely changes what the number means. A naturally aspirated engine consumes roughly its own displacement in air every two revolutions, so its displacement is a direct proxy for air-flow potential. A boosted engine multiplies the density of that charge instead, so it gets big-engine air through small-engine geometry.
The family chart makes the pattern visible once you look for it. The naturally aspirated rows — the 7.3 L Godzilla, the 7.0 L LS7, the F22C1 — sit at the large end of their segments precisely because they cannot cheat with boost. The boosted rows — the Hellcat's supercharged 6,166 cc, the H2's supercharged 998 cc, the 2JZ-GTE's twin-turbo 2,997 cc, the turbo-diesel Cummins rows — are sized by platform rules and block strength, then given boost to hit their power targets. A supercharger does not care whether the cylinders it feeds are 166 cc each or 771 cc each; the chart number stays identical either way.
Rule of thumb when comparing rows
Compare naturally aspirated engines by displacement directly. Compare boosted engines by displacement only for packaging, strength and class-legality questions — for power potential, multiply displacement by how much air the forced-induction system supplies. That is why a 998 cc supercharged H2 sits in the same power conversation as a 998 cc R1 that makes a third of its horsepower.
Your Engine Isn't on the Chart? Measure It
This chart covers the engine families people actually ask about, but rebuilt, stroked and swapped engines — the ones most likely to surprise you — are by definition not factory rows. Measuring your own displacement takes three numbers. Bore: measure the cylinder diameter with a dial bore gauge or, less precisely, read it from the machine shop's final-machining sheet. Stroke: crankshaft throw times two, available from any crank spec sheet for your family. Cylinders: count them — but check the head config first, because a "V8" that is really a 6-cylinder short-block has fooled more than one buyer.
Enter the three numbers into the displacement calculator and you will have your true cc, ci and liter figures — the ones that matter for class tech, compression planning and honest bench racing. A stroked 350 with 3.75 in cranks, for example, is not "about a 350": it computes to 383 ci exactly like the chart's stroker row, and every downstream decision from carb sizing to gear choice should use the computed number.
Engine Displacement Chart — FAQ
How do I use an engine displacement chart?
Why does the chart show 6,163 cc for an engine badged 6.2 liters?
How many cubic inches is a 5.7 HEMI?
What does 2.0 L mean on a car badge?
Why does the 7.3 L Power Stroke row have no bore and stroke listed?
Are motorcycle cc and car cc measured the same way?
Does turbocharging or supercharging change the displacement in the chart?
Is a bigger chart number always better for towing and hauling?
Related Guides & Resources
Engine Rebuild Process — From Teardown to First Start, the Complete Roadmap
The complete rebuild roadmap: ten ordered steps from planning and teardown to break-in, the trap hiding in each step, a part-reusability checklist, and a stage-by-stage table wiring every compression calculator into the workflow.
Big Block vs Small Block — What Separates Them, Bore Spacing Included
What actually separates big blocks from small blocks: bore spacing with a verified family table (4.40 vs 4.84 in and every Ford/Mopar family), casting differences, size and cost comparison, and the odd cases explained — 396 big blocks, 400 small blocks, LS, Godzilla.
Two-Stroke vs Four-Stroke Engine — How Each Cycle Works, and Which One You Need
Both cycles explained step by step: the four-stroke's cam-timed two revolutions vs the two-stroke's ported single revolution, a line-by-line comparison table (power strokes, valves, lubrication, emissions, maintenance), and a pick table for every common tool.
How to Measure Cylinder Bore — Dial Bore Gauge Setup, Taper, Out-of-Round, and Wear Limits
Hands-on cylinder bore measurement: dial bore gauge vs telescoping gauge selection and zeroing, three-depth two-axis technique, taper and out-of-round math with an interactive calculator, wear-limit verdicts and bore scoring / polishing identification.
Engine Bore and Stroke — What They Mean, Bore-vs-Stroke Ratio, and Square / Oversquare / Undersquare
Bore and stroke defined: cylinder diameter vs piston travel, the bore/stroke ratio formula, square vs oversquare vs undersquare classification with verified factory data, an interactive ratio checker, and stroker & bored-over geometry.
Engine Displacement Defined — Formula, Bore, Stroke, and Everything You Need to Know
Complete displacement definition: π/4 × bore² × stroke × cylinders derivation, cc vs liters vs cubic inches, oversquare vs undersquare geometry, CR relationship, power and fuel-economy effects, variable displacement systems.
How to Estimate Compression Ratio from a Compression Test Reading
Reverse engineering CR from PSI: DCR = (PSI/14.7)^(1/1.3) polytropic inverse, why only DCR not SCR, reverse SCR from DCR using known cam IVC, PSI reading limitations (temperature, RPM, seal), step-by-step procedure.
Cam Timing and Dynamic Compression Ratio — Why a Wild Cam Lowers Your Octane Requirement
IVC angle (Intake Valve Close) DCR dominance, why late IVC = lower DCR, cam duration vs IVC relationship, using wild cam to drop octane 93→87, Harley Twin Cam 1550cc stock vs custom case study, cam card reading guide.
Head Milling & Decking Block — How Much Does Each Mill Change Compression Ratio?
Machining physics: head milling chamber CC reduction by 0.010" (0.8-1.2 cc varying by hemispherical/wedge/pentroof shape), decking block clearance change, gasket thickness CR tuning efficiency, 350 SBC case study 8.5→10.5 CR.
Compression Ratio to PSI — Polytropic Compression Physics & Engine Health Diagnosis
Polytropic vs isentropic compression physics, n=1.3 vs n=1.4 explanation, altitude P_atm correction, compression test procedure, normal PSI ranges by DCR, diagnosis matrix (rings vs valves vs head gasket).
Effective Compression Ratio with Turbo & Supercharger — What ECR Means for Detonation
Boost physics: why turbo/supercharger create pre-compression, ECR = DCR × (boost/14.7 + 1) derivation, Turbo vs Supercharger intake temp, detonation window visualization, 2JZ-GTE E85 case study.
Compression Ratio Formula — Every Term Explained with Engineering Context
Engineering-level formula derivation: CR = (Vd + Vc) / Vc from Otto Cycle thermodynamics, Vd = (π/4)bore²stroke geometry, Vc four-component breakdown, Metric vs Imperial conversion, polytropic pressure P ≈ 14.7 × DCR^n.
How to Calculate Compression Ratio — Step-by-Step with Real Engine Example
Complete hands-on guide: tools list, step-by-step measurements (bore mic, stroke, burette chamber cc, piston dome, gasket thickness, deck clearance), full worked Chevy SBC 350 example, error propagation.
Static vs Dynamic Compression Ratio — Why the Difference Is Everything for Fuel Choice
Formula-level deep dive: SCR pure geometry vs DCR real physics, IVC angle, slider-crank derivation, rod ratio effect, octane decision matrix, real LS3 stock vs cammed example.
What Is Compression Ratio in an Engine? Complete Guide with Formulas & Examples
Complete guide to engine compression ratio — physical meaning, formula, every variable explained, BDC vs TDC, swept vs clearance volume, 8:1 vs 12:1 comparison, thermal efficiency.
Overbore Calc
Nominal bore + oversize → bored-over displacement in ci/cc/L with gain and percent, all standard oversizes, plus boring cost examples and big bore kit math.
Displacement Calc
Calculate engine displacement from bore, stroke and cylinders. Results in cc, cubic inches and liters, with a reverse bore/stroke solver and ci↔cc↔L converter.
Racing CR Presets
One-click compression ratio presets for 350 SBC, 383 stroker, 440 Mopar, LS1–LS7, Coyote, Hemi, 351W, and Pontiac 400 — each with DCR and octane recommendation.
2-Stroke CR
Two-stroke compression ratio calculator with corrected CR from port timing. Predator 212 and TZ250 presets, 2-stroke vs 4-stroke CR comparison, small-engine octane.
Gasket vs CR
See how gasket thickness and head milling move compression ratio. Bore + Δthickness → ΔCR live output, gasket material effects, D16 Honda worked example.
Clearance Volume
Calculate clearance volume from displacement and compression ratio, or reverse-solve the missing Vc component — chamber, gasket, deck, or piston dome cc.
Piston Comp Height
Bore, stroke, rod length, and dome volume in — required piston compression height and deck clearance out. OEM vs aftermarket reference values for stroker builds.
Octane by DCR
Enter dynamic CR, altitude, head material, and quench to see if 87, 89, 91, 93, E85, or race fuel is right. Altitude and aluminum-head correction built in.
Metric CR Calculator
Pure metric-unit compression ratio calculator. Bore/stroke in mm, altitude in meters, results in bar and kPa. European and Japanese engine presets.
ECR with Boost
SCR or DCR plus boost PSI → effective compression ratio. Turbo vs supercharger ECR difference, target octane → max safe SCR, detonation risk matrix.
CR to PSI Calculator
Convert compression ratio to cranking PSI and back. Polytropic vs isentropic, altitude correction, visual CR-to-PSI table 7:1–15:1.